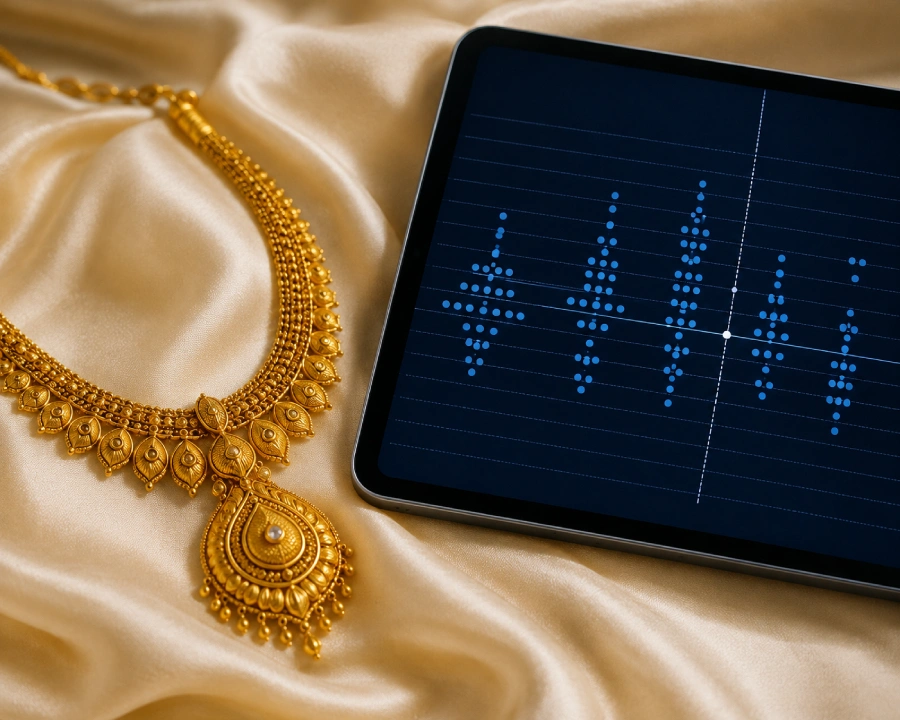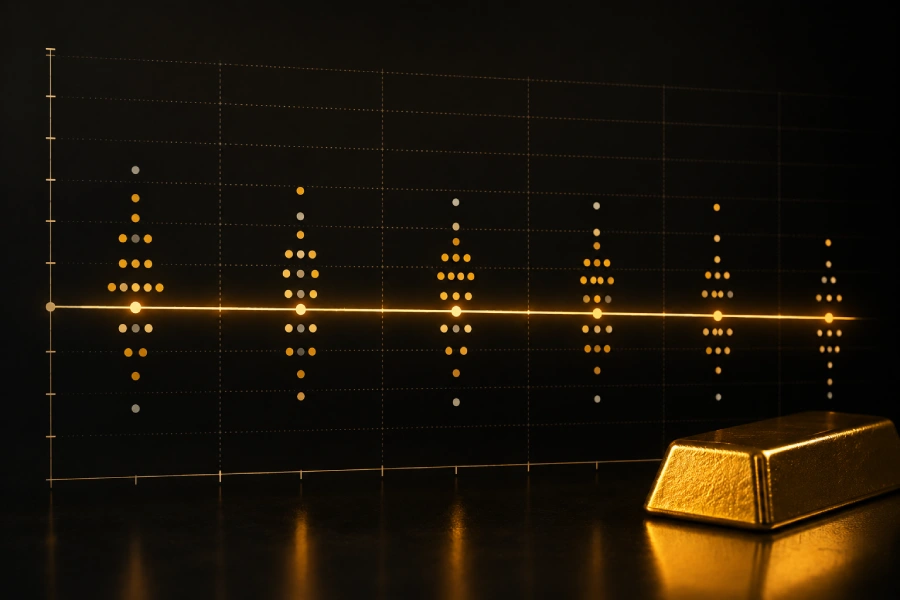
Today the Federal Reserve will publish a chart made up of small dots. To most people it means nothing. To the gold market, it is the single most important thing being released this Wednesday June 17 — more important than the rate decision itself. Here is what the dot plot is, why it matters so much for gold, and what each possible outcome means for the price you pay.
The dot plot is part of the Fed’s quarterly Summary of Economic Projections. Each of the Fed’s officials places a single dot on a chart showing where they think interest rates should be at the end of the year. The median of those dots — the middle value — tells the market the Fed’s collective expectation for the rate path. It is not a promise, but it is the clearest signal the Fed gives about its intentions.
Why does this matter for gold? Because gold has no interest yield of its own. When the Fed signals rates will stay high or go higher, holding cash or bonds becomes more attractive than holding gold, and gold faces pressure. When the Fed signals rates will fall, gold becomes more attractive and rises. The dot plot is the Fed’s roadmap for that decision, and the gold market reads it carefully.
Here is the situation today. In March, the Fed’s dot plot still showed a median projection of one rate cut in 2026. But since then, May inflation came in at 4.2% — the highest since April 2023 — driven by the energy shock from the Iran war. Analysts now widely expect the Fed to remove that projected cut from the new dot plot, signalling rates stay on hold all year.
Now the crucial part for gold. The market has already priced in a very hawkish Fed — traders see roughly 70% odds of at least one rate hike by December. So the question is not whether the dot plot is hawkish, but whether it is more or less hawkish than the market already fears. If the dots show “no cuts, no hikes,” that is actually a relief versus current fears, and gold could rally. If the dots show members projecting actual hikes, gold faces renewed pressure. This gap between expectation and reality is why the dot plot could move gold by $100 in either direction within minutes of the 2:00 PM release.
For Gulf jewellery buyers, the timing matters. Gold at $4,349 is up 3.6% on the week thanks to the Iran peace deal that reopened the Strait of Hormuz and sent oil to a two-month low. The falling oil price means the inflation that justified the Fed’s hawkishness is fading — which over time supports a higher gold price regardless of today’s dot plot. The structural demand remains strong: central banks bought 244 tonnes in Q1 2026 and continue accumulating.